

With businesses becoming inundated with data, even those with analytics solutions in place can become confused about how to extract the kind of insights that drive better decision making and impact the core goals of the business. It’s important to understand the various types of data analytics so you can identify where you are on your journey to data literacy and analytics empowerment.
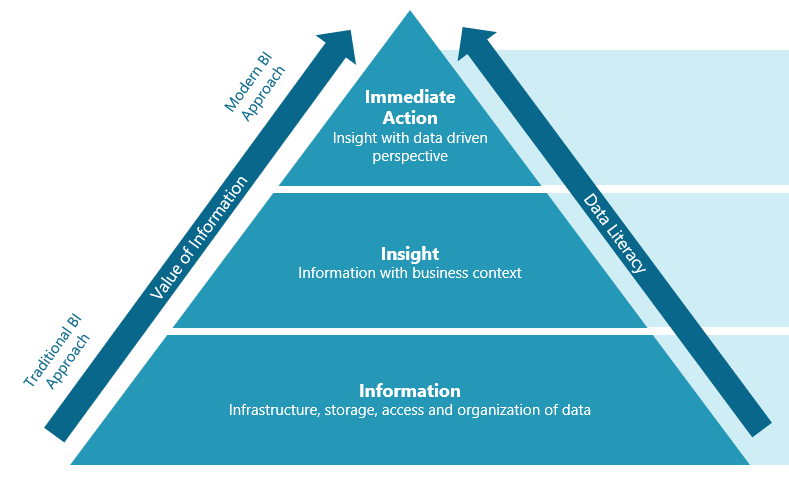
We like to think of the journey to data analytics empowerment as having three stages. Here’s a visualization of our data analytics maturity model:
5 Core Types of Data Analytics
1. Descriptive analytics.
Descriptive analytics basically refers to statistics. This is the first step of the data analytics maturity model, in which you collect information about what’s happened in the past in order to discover patterns and choose the most important key metrics for success. You may study how well a particular item sells and discover that certain seasons work better for offering specific products or services. This information gives you greater insight into the current state of your business and allows you to benchmark so you can see how future changes impact it.
2. Diagnostic analytics.
Diagnostic analytics is a method of exploring a specific situation in depth to identify the source of a challenge or opportunity. This is similar to the way a medical practitioner evaluates a patient’s symptoms one by one to identify the underlying cause of an illness.
Microsoft shared a great example of an ice cream parlor using descriptive and diagnostic analytics to answer specific questions about their business performance. Molly Moon’s noticed that their two strawberry flavors, regular strawberry and balsamic strawberry, always ranked unreasonably low on their “always” menu. They wondered if offering two strawberry flavors was diluting sales. So they studied their sales data and decided to offer balsamic as a topping instead. This allowed them to replace the balsamic strawberry flavor with a seasonal top seller, Cookie Dough, adding more variety to the menu, increasing overall sales, and allowing the regular strawberry flavor to move up in the rankings and pull its weight properly.
Not all examples of data analytics are as delicious as Molly Moon’s, but this example applies to anyone marketing a product. Descriptive and diagnostic data analytics makes it possible to understand what customers want and offer it in a way that makes the buying decision simple and straightforward.
3. Predictive analytics.
Predictive analytics helps you to forecast trends based on what’s happening today, predict the probability that an event will occur in the future, and even help estimate when it will happen. This method of data analytics begins to move the business upward toward a level of insight that allows you to assess potential future risk.
A common example of predictive analytics at work in the healthcare industry is the ability to assess the health risk of patients based on their habits, lifestyle, genetics, environment, etc. Predictive analytics processes a variety of contextual inputs that makes it easier to get future insight without understanding the science behind the data.
Predictive analytics is powerful, but it only reaches its full potential to impact decision making when combined with prescriptive analytics. Both Microsoft Power BI and Tableau offer predictive analytics capabilities with visualizations to help the everyday business user access future insights, as well as integrations with prescriptive analytics tools to create a full analytics solution.
4. Prescriptive analytics.
Prescriptive analytics takes future insight to the next level by evaluating a variety of options for arriving at an outcome. A common example of prescriptive analytics would be your favorite GPS app. It will look at every available route to your destination and evaluate the step-by-step process for each to determine which route is fastest. The app relies on a variety of inputs to reach its recommendation, including location data for your device as well as traffic information incoming from other connected devices that could indicate a crash or slowdown to avoid.
Prescriptive analytics can show you how best to respond to what’s likely to happen tomorrow and moves you up the data analytics maturity model to the point where you can make faster and more effective decisions.
5. Augmented analytics.
Augmented analytics is at the very top of the analytics maturity model. Because it uses machine learning and artificial intelligence techniques to automate data preparation, insight discovery and sharing, augmented analytics allows business users with no data science training whatsoever to access more advanced and immediate insights on demand.
For example, augmented analytics includes the use of natural language processing. Imagine if you could pick up your phone and ask Siri how you could improve your marketing strategy--and get a coherent response outlining the exact steps to take for optimal business results.
Rather than taking the time to run different scenarios through predictive/prescriptive analytics models to choose the best one, the idea behind augmented analytics is that you can press a button and get your answer immediately. This is possible because augmented analytics also automates data science and machine learning model development and deployment, freeing up time for data scientists to focus on more valuable tasks and allowing business users to self-serve.
Reaching this stage of maturity requires an advanced level of investment in the time and skills necessary to design the organization’s data strategy and BI strategy, taking into consideration aspects like data cleansing, data quality, data integration, data governance and master data management.
What's Right for You?
Developing these machine learning techniques isn’t the best option for every organization. It’s great to aim high, but if your business is operating at the lower end of the maturity model, it’s best to focus on SMART goals that focus on business needs first over creating the most advanced data analytics strategy possible.
Solutions should be right-sized to fit your unique business needs, and tailored to the industry you operate within. Onebridge can help you answer these questions and determine what kind of solution is right for you. Get in touch with us today to learn more about how to tailor a data strategy to your business.


